|
Ocean Wave Forecasts (WAM-TMD Model)
การพยากรณ์คลื่นมหาสมุทร โดยใช้โมเดล WAM-TMD
Ocean wave forecasting for each grid point
การพยากรณ์คลื่นมหาสมุทรสำหรับแต่ละจุดพิกัด
Fine Grid of Ocean Wave Forecasting For Each Grid Point
If you want to see the sea state on grid system, your computer must have Java software
which you can download at http://www.java.com/en/download/manual.jsp
ถ้าคุณต้องการเห็นลักษณะคลื่นบนระบบจุดพิกัด เครื่องของคุณต้องติดตั้งซอฟแวร์จาวา
ซึ่งคุณสามารถดาวน์โหลดได้ที่http://www.java.com/en/download/manual.jsp
|
The wave spectrum is the term that describes mathematically the distribution of wave energy with frequency and direction. The wave spectrum consists of a range of frequencies.
Remember that ocean waves are composed of a multitude of sine waves, each having a different frequency. For purposes of explanation, these frequencies are arranged in ascending order from left to right,
ranging from the low-valued frequencies on the left to the high-valued frequencies on the right, A particular range of frequencies, for instance, from 0.05 to 0.10 does not, however, represent only six different frequencies of sine waves,
but an infinite number of sine waves whose frequencies range between 0.05 and 0.10. Each sine wave contains a certain amount of energy, and the energy of all the sine waves added together is equal to the total energy present in the ocean waves.
The total energy present in the ocean waves is not distributed equally throughout the range of frequencies; instead, in every spectrum, the energy is concentrated around a particular frequency (fmax), that corresponds to a certain wind speed.
|
สเปกตรัมของคลื่นเป็นคำที่อธิบายการกระจายตัวของพลังงานคลื่นในเชิงคณิตศาสตร์ไปตามค่าความถี่และทิศทางของคลื่น
สเปกตรัมของคลื่นประกอบด้วยช่วงของความถี่คลื่น โปรดจำไว้ว่าคลื่นทะเลจะประกอบด้วยความหลากหลายของคลื่นไซน์ ซึ่งคลื่นแต่ละชุดจะมีความถี่ที่แตกต่างกัน
สำหรับจุดประสงค์ของคำอธิบายความถี่ของคลื่นเหล่านี้ จะมีการจัดลำดับจากซ้ายไปขวาเริ่มตั้งแต่ความถี่ต่ำของคลื่น ซึ่งมีค่าอยู่ทางด้านซ้ายของกราฟ และเพิ่มขึ้นไปทางด้านขวา
ช่วงใดช่วงหนึ่งของความถี่คลื่น ตัวอย่างเช่นความถี่คลื่นในช่วง 0.05 - 0.10 จะต้องถูกแบ่งช่วงความถี่เป็น 6 ช่วงความถี่ที่แตกต่างจากคลื่นไซน์ แต่จำนวนอนันต์ของคลื่นไซน์ที่มีความถี่คลื่นในช่วงระหว่าง 0.05 และ 0.10
คลื่นไซน์แต่ละชุดมีค่าพลังงานของคลื่น และพลังงานของทุกคลื่นไซน์ที่มารวมกันจะให้ค่าของพลังงานคลื่นรวม ซึ่งจะถูกแสดงในรูปของคลื่นมหาสมุทร พลังงานคลื่นรวมทั้งหมดจะแสดงให้เห็นเป็นคลื่นมหาสมุทรจะไม่ถูกกระจายความถี่ของคลื่นอย่างเท่าเทียมกัน แทนด้วยค่าของสเปกตรัม และทุกพลังงานคลื่นที่มีค่าความถี่สูงสุด (fmax) ซึ่งจะมีความสอดคล้องกับความเร็วลมที่พัดแน่นอน
|
|
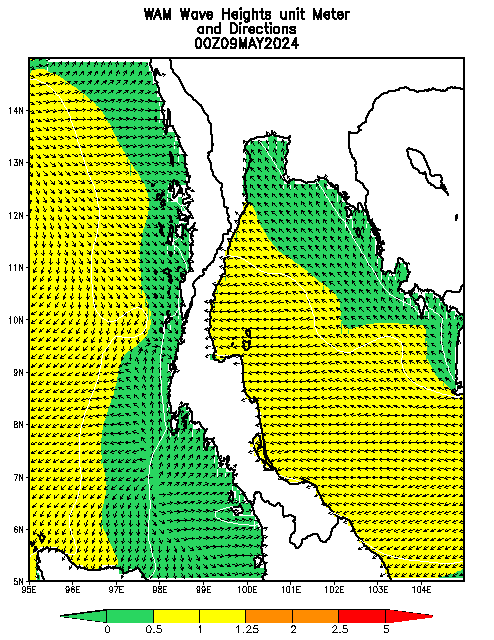
Significant Wave Height Forecast [Big frame of wave and wind]
|
|
การพยากรณ์ความสูงคลื่นนัยสำคัญ เฟรมขนาดใหญ่ คลื่น และ ลม
|
เกณฑ์ในการทำมาตรฐานการเตือนภัยพิบัติเพื่อลดความเสี่ยงและผลกระทบจากภัยธรรมชาติทางทะเล
 
ผลลัพธ์การพยากรณ์ความสูงและทิศทางคลื่นนัยสำคัญใน 2 มิติ
Numerical Wave Prediction Products in 2D
|
In physical oceanography, significant wave height (SWH) is the average wave height (trough to crest) of the one-third largest waves.
Significant wave height, scientifically represented as Hs or Hsig, is one important level when considering the statistical distribution of ocean waves. The most common waves are less than that of Hs. This implies that encountering the significant wave is not frequent. However, statistically, when two significant waves come into phase, it is possible to encounter a wave that is much larger than the significant wave.
|
ในทางสมุทรศาสตร์กายภาพ ความสูงคลื่นนัยสำคัญ (SWH) เป็นความสูงคลื่นเฉลี่ย (วัดจากท้องคลื่นถึงยอดคลื่น) ของหนึ่งในสามของชุดคลื่นที่มีความสูงมากที่สุด ความสูงคลื่นนัยสำคัญในทางวิทยาศาสตร์ใช้ตัวย่อคือ Hs หรือ Hsig ซึ่งมีความสำคัญ เมื่อพิจารณาถึงการกระจายทางสถิติของคลื่นมหาสมุทร คลื่นส่วนใหญ่มีน้อยกว่าคลื่นนัยสำคัญ ซึ่งหมายความว่าคลื่นนัยสำคัญจะพบเห็นได้ไม่บ่อยนัก อย่างไรก็ตามทางสถิติเมื่อทั้งคลื่นนัยสำคัญ 2 ชุด เคลื่อนที่เข้ามาพบกัน มันเป็นไปได้ที่จะพบคลื่นที่มีขนาดใหญ่กว่าคลื่นนัยสำคัญ
|
 
For details about the WAM click : here .
World Ocean Wave Output
By Thai Marine Meteorological Center
Meridian Ocean Wave Output
By Thai Marine Meteorological Center
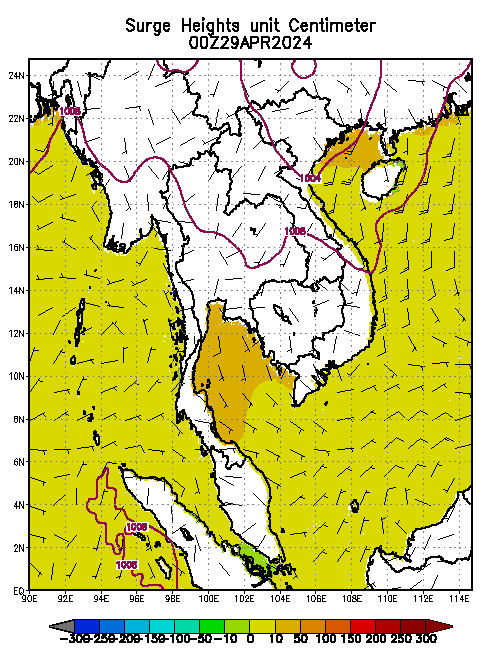
Storm Surge model output
ผลลัพธ์จากแบบจำลองคลื่นพายุซัดฝั่ง
|
Storm surge is an abnormal rise of water generated by a storm, over and above the predicted astronomical tides. Storm surge should not be confused with storm tide, which is defined as the water level rise due to the combination of storm surge and the astronomical tide. This rise in water level can cause extreme flooding in coastal areas particularly when storm surge coincides with normal high tide, resulting in storm tides reaching up to 20 feet or more in some cases.
|
คลื่นพายุซัดฝั่งเป็นการเพิ่มขึ้นอย่างผิดปกติของระดับน้ำซึ่งได้รับอิทธิพลจากการเคลื่อนตัวขึ้นฝั่งของพายุหมุนเขตร้อน ซึ่งความสูงของระดับน้ำทะเลมากกว่าระดับความสูงจากการคาดการณ์ระดับน้ำขึ้น-น้ำลงเนื่องจากอิทธิพลแรงดึงดูดของโลก ดวงจันทร์ และดวงอาทิตย์ คำว่าคลื่นพายุซัดฝั่ง (Storm Surge) ไม่ควรจะมีการสับสนกับคำว่าสตอร์มไทด์ (Storm Tide) เพราะว่าสตอร์มไทด์ ถูกนิยามว่าเป็นระดับน้ำที่เพิ่มขึ้นเนื่องจากการรวมกันของการเพิ่มขึ้นของระดับน้ำจากอิทธิพลของพายุหมุนเขตร้อนและระดับน้ำขึ้น-น้ำลงปกติในทางดาราศาสตร์ การเพิ่มขึ้นของระดับน้ำนี้อาจส่งผลทำให้เกิดน้ำท่วมบริเวณพื้นที่ชายฝั่งทะเลอย่างรุนแรง โดยเฉพาะอย่างยิ่งเมื่อระดับน้ำเพิ่มสูงขึ้นเนื่องจากอิทธิพลของพายุหมุนเขตร้อนเกิดขึ้นพร้อมกับระดับน้ำขึ้นสูงสุดปกติ (High Tide) จะส่งผลให้ระดับน้ำสูงขึ้นผิดปกติ และอาจจะมีความสูงของระดับน้ำถึง 20 ฟุตหรือมากกว่านั้นในบางกรณี ไหลบ่าเข้าไปในชายฝั่งทะเลที่เป็นที่ลุ่มต่ำ
|
Sea Water level Changing Graphs by Atmospheric forces (wind and air pressure) along Thailand Coastline.
กราฟการพยากรณ์การเปลี่ยนแปลงของระดับน้ำทะเลปานกลางตามชายฝั่งทะเลประเทศไทย เนื่องจากอิทธิพลของลมและความกดอากาศ
 
Lam Sing
Lat.12-28,Lon.102-04 |
Ko Matapon
Lat.10-27, Lon.99-15 |
Chaophaya river1
Lat.13-32, Lon.100-36 |
Chaophaya river2
Lat.13-30, Lon.100-34 |
Chaophaya river3
Lat.13-30, Lon.100-37 |
Trat
Lat.12-01, Lon.102-11 |
Chanthaburi
Lat.12-25, Lon.101-55 |
Rayong
Lat.12-34, Lon.101-13 |
Chonburi
Lat.13-01, Lon.100-47 |
Chachoengsao
Lat.13-23, Lon.100-52 |
Samutprakan
Lat.13-23, Lon.100-42 |
Bangkok
Lat.13-23,Lon.100-26 |
Samutsakhon
Lat.13-22, Lon.100-20 |
Samutsongkhram
Lat.13-20, Lon.100-07 |
|
Phetchaburi
Lat.13-05, Lon.100-13
|
Prachuapkhirikhan
Lat.12-11, Lon.100-07
|
Chumphon
Lat.10-32,Lon.99-23
|
Suratthani
Lat.9-34, Lon.99-22
|
Nakhonsithammarat
Lat.8-47, Lon.100-04
|
Songkhla
Lat.7-35, Lon.100-30
|
Pattani
Lat.7-02, Lon.101-15
|
|
Narathiwat
Lat.6-31, Lon.101-54
|
Satun
Lat.6-55, Lon.99-34
|
Trang
Lat.7-27, Lon.99-14
|
Krabi
Lat.7-57, Lon.98-43
|
Phuket
Lat.7-41, Lon.98-15
|
Phangnga
Lat.8-25, Lon.98-07
|
Ranong
Lat.9-38, Lon.98-23
|
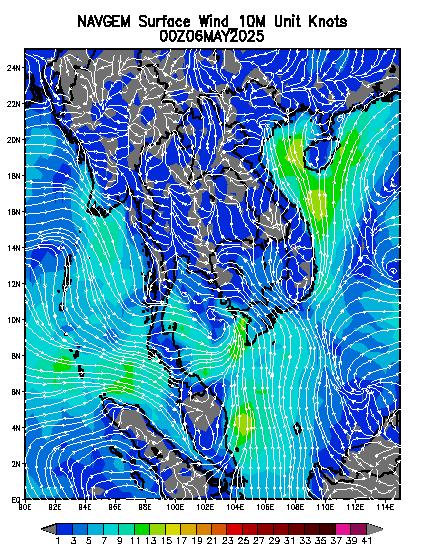
Wind speed and direction at 10 meters
ความเร็วและทิศทางลมที่ระดับ 10เมตร
 
|
The World Meteorological Organization has set the international standard height for wind measurement devices at 10 meters (33 feet) above ground, with no obstructions at or above this level.
|
Wind Wave and Storm Surge model output
ผลลัพธ์จากแบบจำลองคลื่นลมและแบบจำลองคลื่นพายุซัดฝั่ง
 

โมเดลจำลองการเคลื่อนที่ของสึนามิซึ่งรันบนไมโครซอฟวินโดว์
These are simulation by using SiTProS model. (Study case.)
ภาพเคลื่อนไหวข้างล่างเหล่านี้คือการจำลองแบบโดยใช้โมเดลซิทโปรส (SiTProS) (กรณีศึกษา)
|
The word tsunami (pronounced soo-NAH-mee) is Japanese, and it means harbour wave.
A tsunami is a huge volume of moving seawater. These big waves can travel for thousands of kilometers across the sea and still have enough energy and force to destroy buildings, trees, wildlife and people.
|
Visitor Statistic
You are number of

|

